3i Group plc
Annual report and accounts 2025 highlights


Our purpose
We generate attractive returns for our shareholders and co-investors by investing in private equity and infrastructure assets.
As proprietary capital investors, we have a long-term, responsible approach. We aim to compound value through thoughtful origination, disciplined investment and active management of our assets, driving sustainable growth in our investee companies.
Download the FY2025 Annual Report
FY2025 performance
FY2025 performance

“I am pleased to report that 3i delivered another strong set of results in the financial year to 31 March 2025, consistent with our excellent track record of growth since the restructuring in 2012.”
FY2025 performance
-
2,542p
NAV per share
(31 March 2024: 2,085p)
-
25%
Total return on equity
(2024: 23%)
-
73.0p
Dividend per share
(2024: 61.0p)

“In FY2025, we generated a total return on shareholders’ funds of £5,049 million, or 25%, ending the year with a NAV per share of 2,542 pence. This is the fifth consecutive year we have delivered a total return over 20%; over this same period, our average annual total return was 30%.”
Long-term performance

At a glance
3i is an investment company specialising in Private Equity and Infrastructure.
We invest in mid-market companies headquartered in Europe and North America. Our largest investment, Action, is an example of our successful strategy of compounding value over the long term, delivering consistent returns for our shareholders.
3i Group investment portfolio value As at 31 March 2025
£25.6bn
(2024: £21.6bn)
-
Private Equity
£23.6bn
-
Infrastructure
£1.5bn
-
Scandlines
£0.5bn
Total assets under management As at 31 March 2025
£38.7bn
(2024: £34.7bn)
-
Private Equity
£31.9bn
-
Infrastructure
£6.3bn
-
Scandlines
£0.5bn
3i Group investment portfolio by sector as at 31 March 2025
74%
8%
5%
5%
4%
4%
We invest our proprietary capital in mid market businesses headquartered in Europe and North America. Once invested, we work closely with our portfolio companies to deliver ambitious growth plans and aim to compound value from our best investments over the longer term.
DownloadPrivate Equity business review
-
Gross investment return
£5,113m or 26%
(2024: £4,059m or 25%)
-
Cash Investment
£1,177m
(2024: £556m)
-
Realised proceeds
£1,827m
(2024: £866m)
-
Portfolio dividend income
£450m
(2024: £439m)
-
Portfolio growing earnings
97%1
(2024: 93%)
-
Portfolio value
£23,558m
(2024: £19,629m)
Long term hold investments
Action
What is Action?
Action is the fastest growing non-food discount retailer in Europe. At the end of March 2025, Action had 2,967 stores. Action offers its customers an ever changing variety of 6,000 products at the lowest price.
Our investment in Action
Following our initial investment in 2011, we have actively managed Action through its pan-European roll-out, with the business achieving revenue of €13.8 billion in 2024.
At 31 March 2025, our investment in Action formed 76% of our Private Equity portfolio value. The business has returned over £4.6 billion of proceeds over our holding period.

Regional Rail
What is Regional Rail?
Regional Rail acquired Cincinnati Eastern Railroad in July 2024, adding 70 miles of track in Ohio.
The railroad provides freight hauling and storage services to customers across a variety of end markets, including aggregates, food & agriculture, and paper products, and is poised to benefit from continued industrial development in the region.
The acquisition further expands Regional Rail’s Midwest US presence and diversifies its customer and commodity exposures. Regional Rail has grown from three railroads in the Northeast US to 16 operations across North America.

Nexeye
What is Nexeye?
nexeye is a European value for-money optical retail platform, operating under the Hans Anders, eyes+more and Direkt Optik labels.
Our investment in Nexeye
We invested £205 million in the business throughout our ownership.
During our investment, nexeye transformed from a local optical discounter to the value-for-money leader in the North-West European optical retail market. nexeye shifted its business model towards digitally generated appointments, accelerated its digital marketing and CRM capabilities and drove store productivity through digital planning. As a result, sales and EBITDA doubled under our ownership.
In July 2024, we completed the sale of nexeye, returning proceeds of £382 million, which, combined with distributions received during our ownership, resulted in a sterling money multiple of 2.0x.

WP
What is WP?
WP is a leading provider of innovative plastic packaging solutions, with over 4,000 employees and 23 facilities in 15 countries.
The company supplies the world’s leading A-brands and private label players.
Our investment in WP
We invested £147 million in WP, supporting its international growth strategy through expansion into new product categories and strengthened its position in its existing segments. WP also completed four bolt-on acquisitions during our period of ownership, significantly reinforcing its presence in Latin America and Europe, and delivered consistent growth, almost doubling its EBITDA.
In October 2024, we sold our investment in WP at an 18% profit over 31 March 2024 value, generating proceeds of £280 million1 which, combined with the £45 million of proceeds received during the period of our ownership, resulted in a sterling money multiple of 2.2x.
1 Including interest income of £3 million. An additional £8 million of deferred consideration was received post year-end in April 2025.

MAIT
MAIT is a leading provider of innovative and pioneering digital solutions in the DACH region, focusing on software in product lifecycle management, enterprise resource planning as well as managed services and cloud solutions.
Our investment in MAIT
Since our investment in 2021, we have supported MAIT in making 13 acquisitions (includes asset deals) that complement its offering in product lifecycle management and enterprise resource planning solutions, including three bolt-on acquisitions in the year, in CAD ’N ORG and ISAP in April 2024, and TFH Technical Services in November 2024. CAD ’N ORG is a provider of software and consulting services, offering complementary software modules, such as a data validation tool which ensures appropriate data quality. ISAP is a provider of consulting services, established for over 30 years, supporting medium sized manufacturing companies with tailor-made digitalisation strategies. TFH technical services is a Dutch consulting provider specialising in the implementation and use of lifecycle management software solutions.

OMS
What is OMS?
OMS Prüfservice (“OMS”), is the largest specialised service provider in testing electrical systems and equipment for B2B customers in the DACH region.
The business has over 900 employees and operates in 43 locations across Germany, Austria and Switzerland. The company tests the electrical safety of portable and fixed equipment in offices and manufacturing facilities, as well as e-mobility infrastructure and photovoltaic systems. Its fully tailored proprietary software platform, INSPEKTRA, enables it to digitalise and automate its testing processes, maximising efficiency and optimising its services to an individual customer level.
Our investment in OMS
OMS is well positioned for future growth, due to its geographic footprint, the increasing digitalisation of workplaces and increased outsourcing, due to the demand for skilled technicians. 3i is investing to drive further growth in OMS’s core business, while exploring new opportunities.

Constellation
What is Constellation?
Constellation, headquartered in Saint-Cloud, France, is an IT managed services provider specialised in hybrid cloud and cyber security, with c.780 employees and a national footprint of 13 agencies, supporting c.600 mid-sized customers.
The company has consistently delivered double-digit organic growth, driven by a strong value proposition and superior service quality that helps retain and attract new customers.
Our investment in Constellation
Constellation has completed 23 acquisitions since 2016. Endexar, a provider of SAP managed services, was acquired on closing and since then, three further bolt-ons have completed: ILKI, a cloud architecture specialist; and Feelserv and Armonie, both hybrid cloud managed service providers.
The business is well positioned to be a key consolidator in a fragmented IT services French market, and our investment will enable it to further accelerate its growth, both organically and through add-ons.

WaterWipes
What is WaterWipes?
WaterWipes is a global, premium, natural wet wipe brand focused on the baby and child category, with new product innovation in the adult category.
It has c.300 employees and is based in Drogheda, Ireland. Its products are sold in over 50 countries, with double-digit growth across both offline and online channels.
Made from natural ingredients, WaterWipes’ superior quality wet wipes are globally accredited by skin health and allergy institutions and endorsed by healthcare professionals. This has earned the brand market-leading levels of customer loyalty and advocacy, driving consistent growth for over a decade.
Our investment in WaterWipes
WaterWipes is the clear premium-segment leader in the c.€12 billion personal care wet wipes market, which is forecast to grow strongly driven by increased hygiene awareness post-Covid and demand for convenience. 3i will support the company’s growth, including its expansion in the US, Europe and new markets.

Royal Sanders
What is Royal Sanders?
Royal Sanders, our other long-term hold asset, is a leading European private label and contract manufacturing producer of personal care products. Since our investment in 2018, we have supported Royal Sanders’ successful international expansion strategy, organically and by accessing new markets, with eight bolt-on acquisitions. The business is also highly cash generative, returning a total of £231 million in distributions to 3i over the seven-year period.
Royal Sanders bolt-on activity in FY2025
Royal Sanders completed its acquisitions of Karium and Treaclemoon in FY2025. Both companies have a strong strategic fit with Royal Sanders’ existing brands business, enabling it to expand its footprint in the personal care market. Karium is a platform of established brands in the hair, body and skin care categories. It serves a broad range of major retailers across the grocery, value and food, drug and mass merchandiser channels. Treaclemoon is a value-for-money personal care brand. Its products are sold through major UK retailers as well as through international distributors.

Our business model
We aim to compound value over time by investing in mid-market companies to create a diverse portfolio with strong growth potential.
We cover our operating costs with income from our portfolio and from fund management fees generated by our Infrastructure business, thereby minimising the dilution of our capital returns.
What enables us to create value
Sectors
Private Equity
Our Private Equity business is funded principally from our proprietary capital, with some funding from co-investors for selected assets. Its principal focus is to generate attractive capital returns.
 Consumer & Private Label
 Healthcare
 Industrial
 Services & Software
Infrastructure
Our Infrastructure business manages assets on behalf of third-party investors and 3i’s proprietary capital, with the objective of generating attractive capital returns and earning fund management fees and portfolio income for the Group.
 Communications
 Utilities
 Transport/Logistics
 Social Infrastructure
 Energy
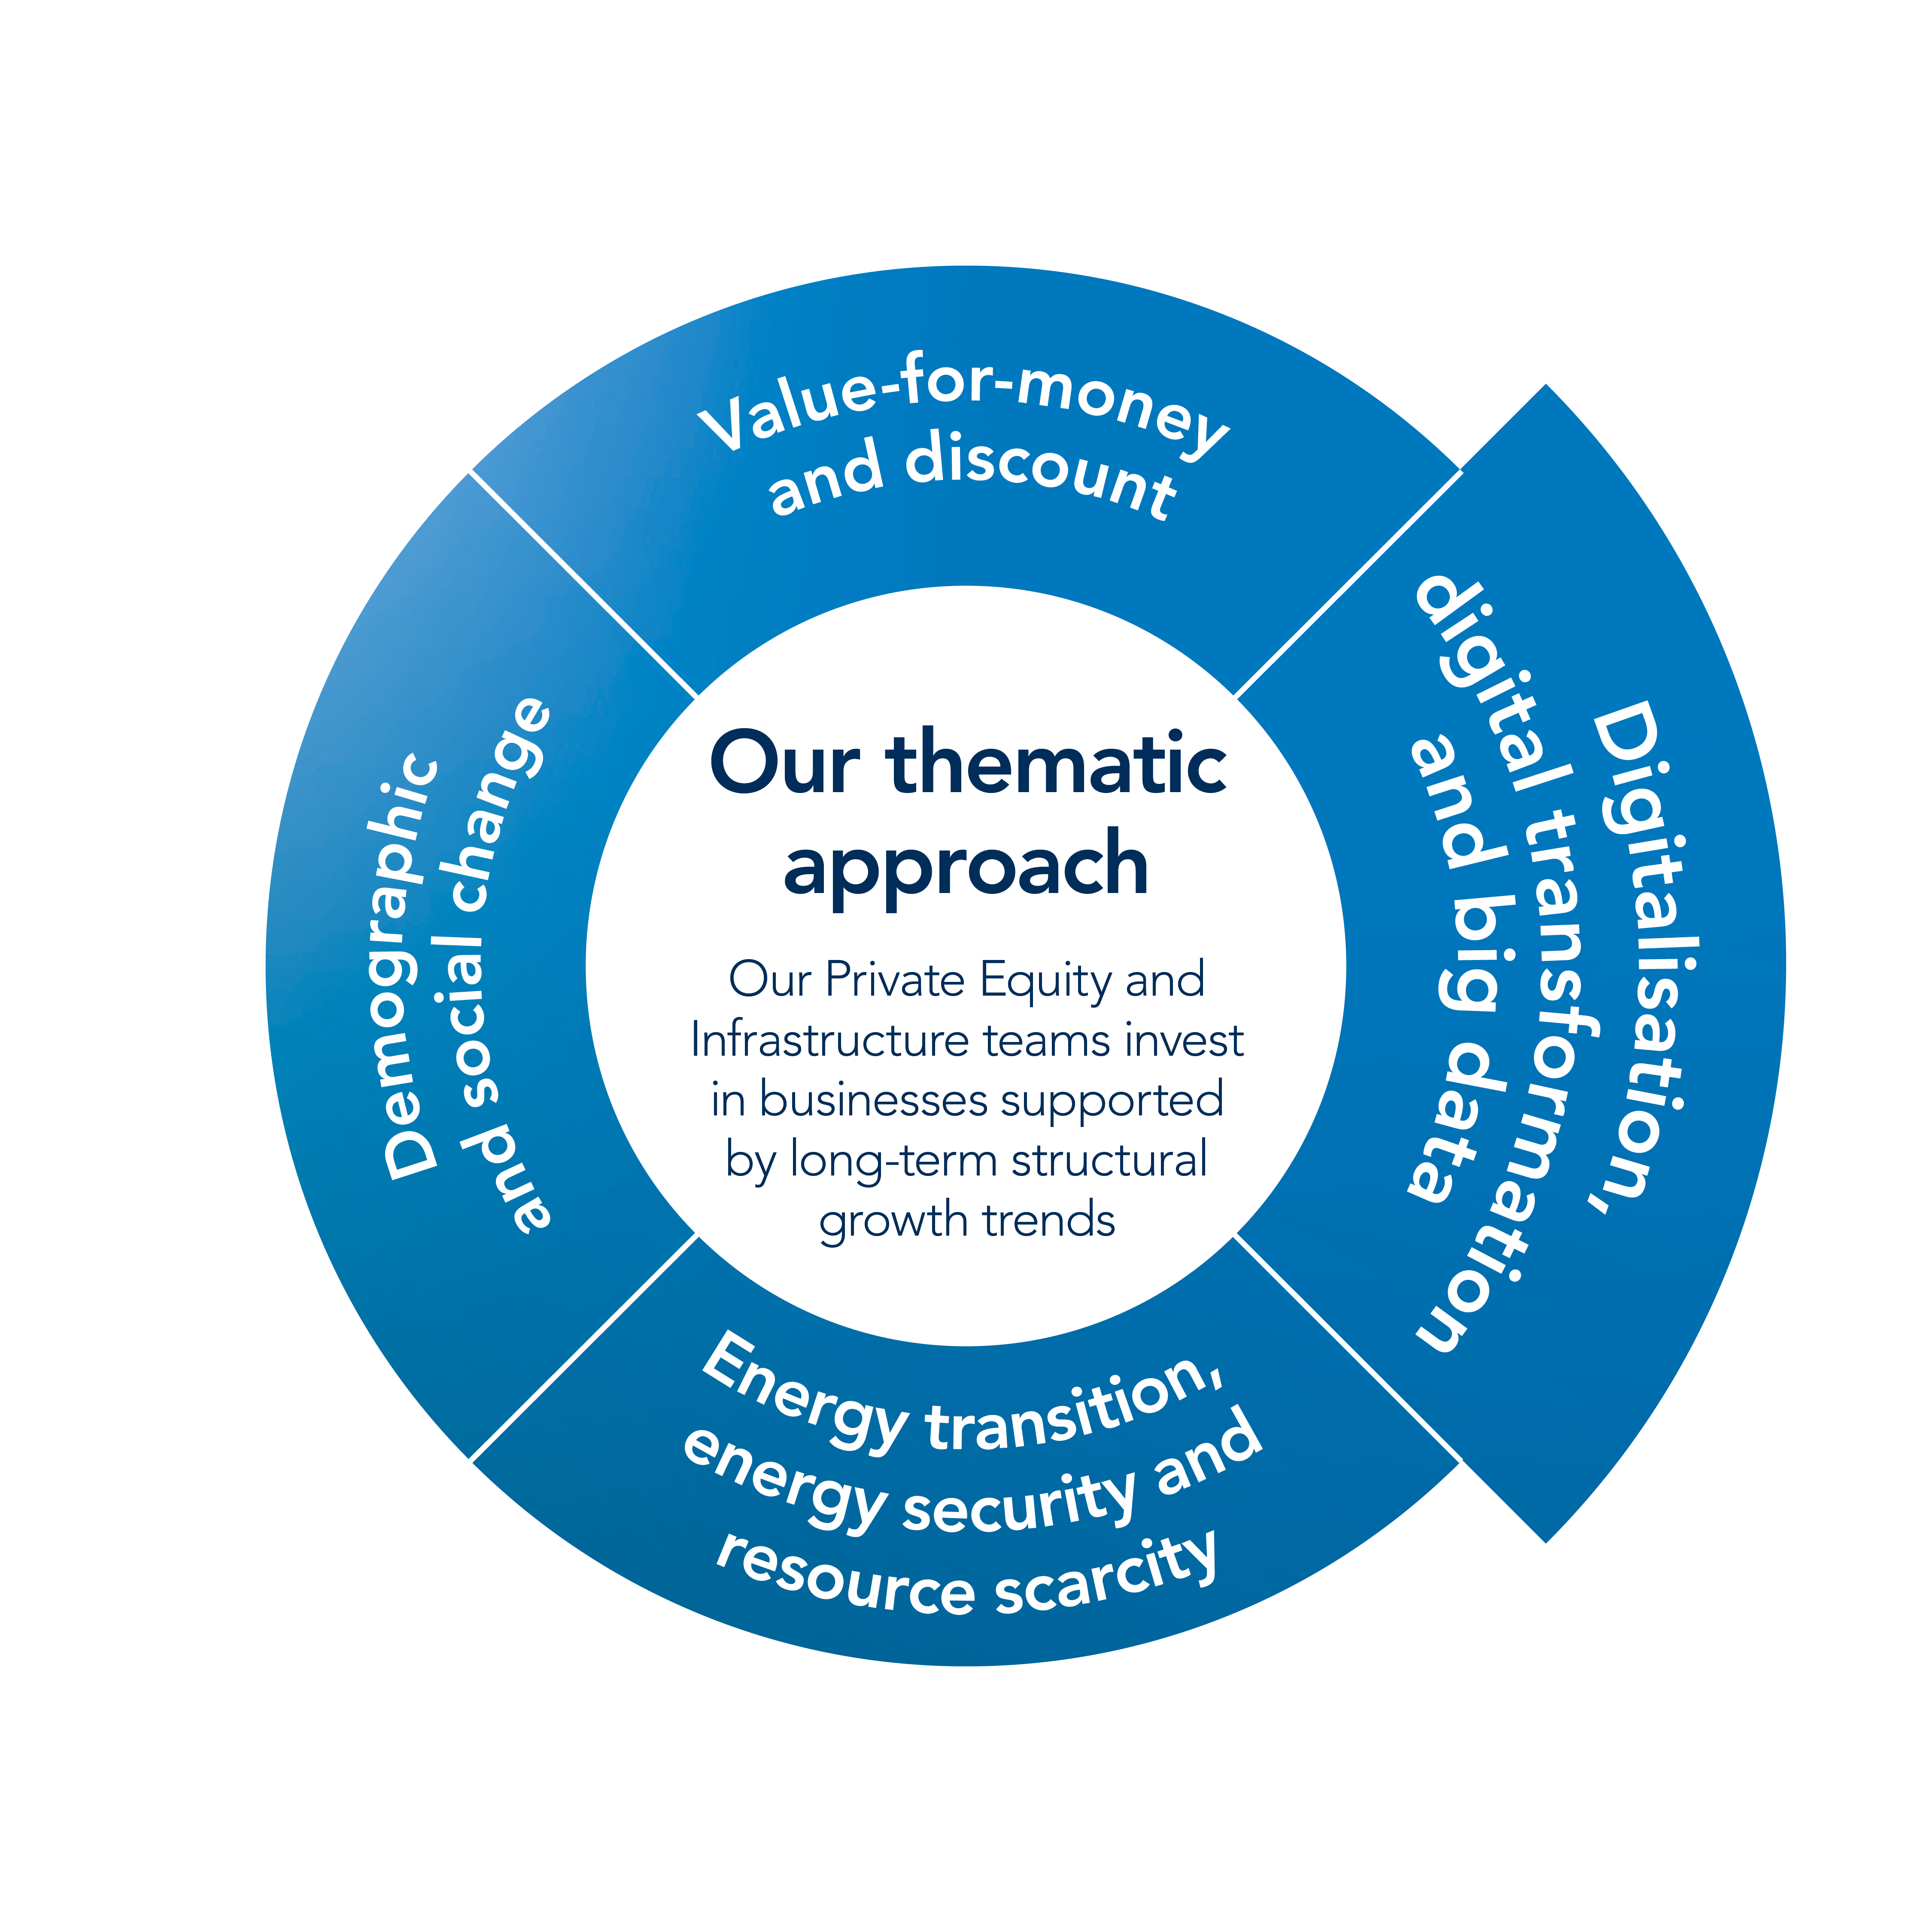
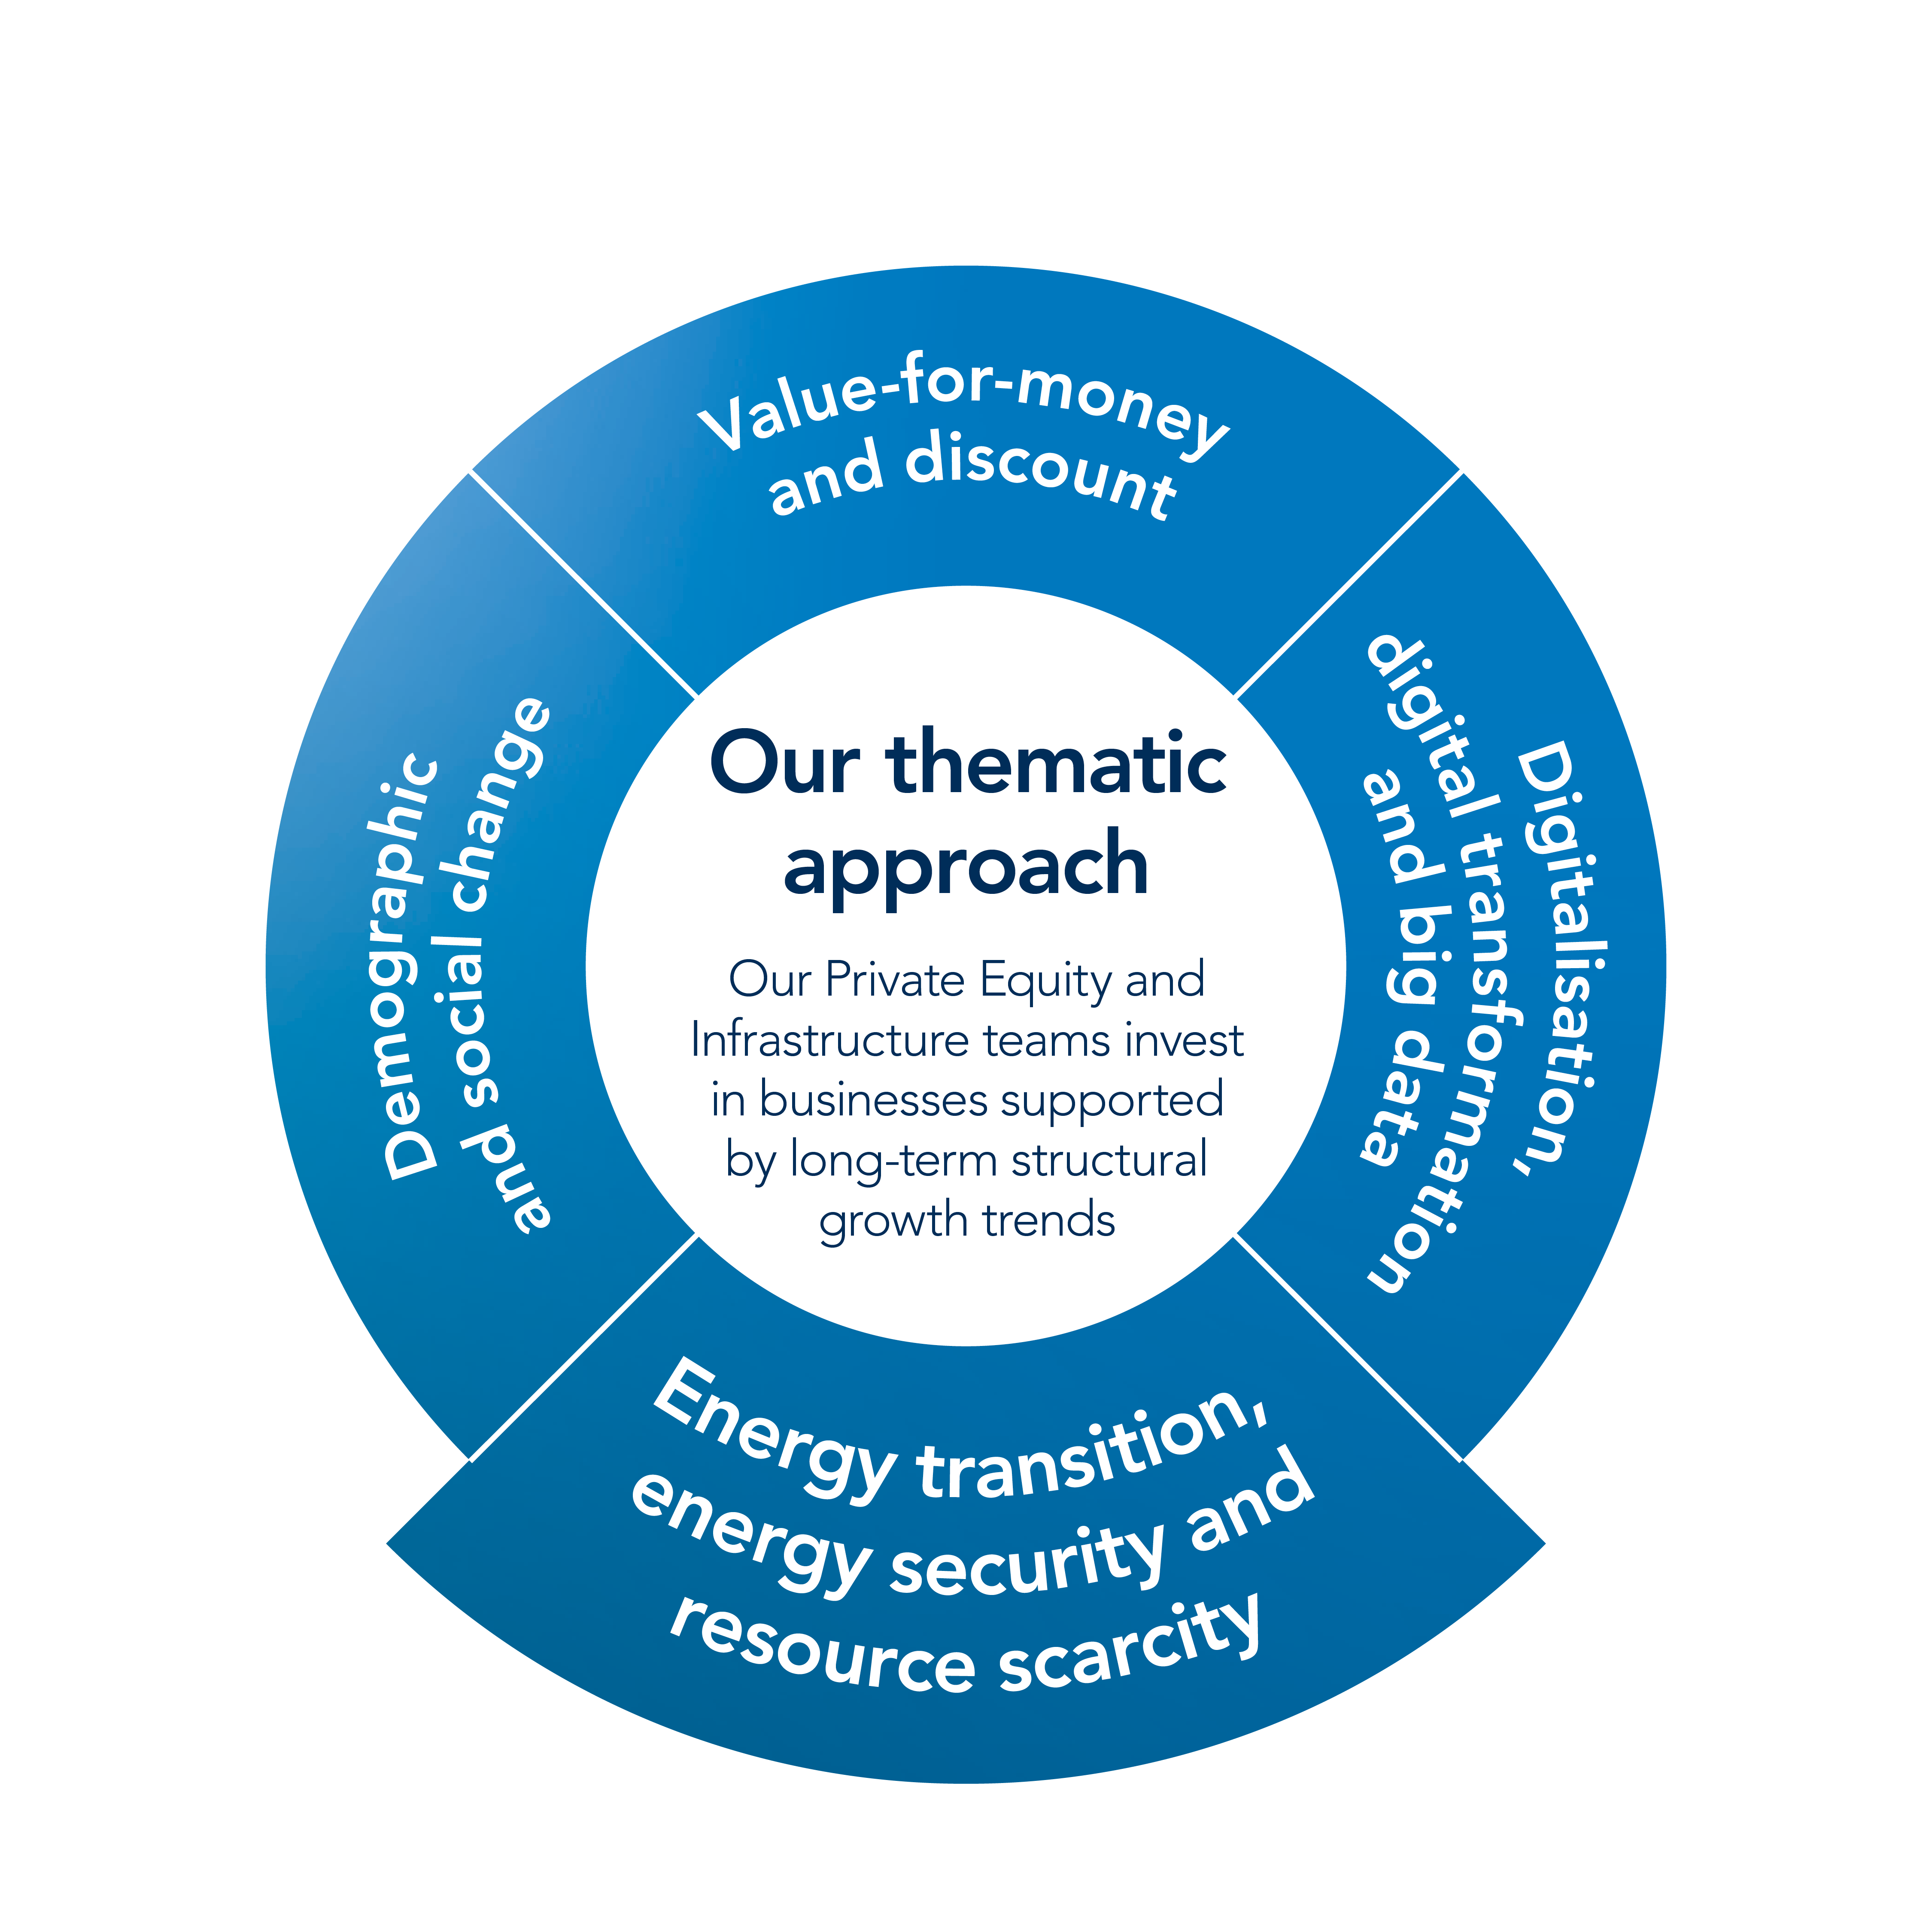
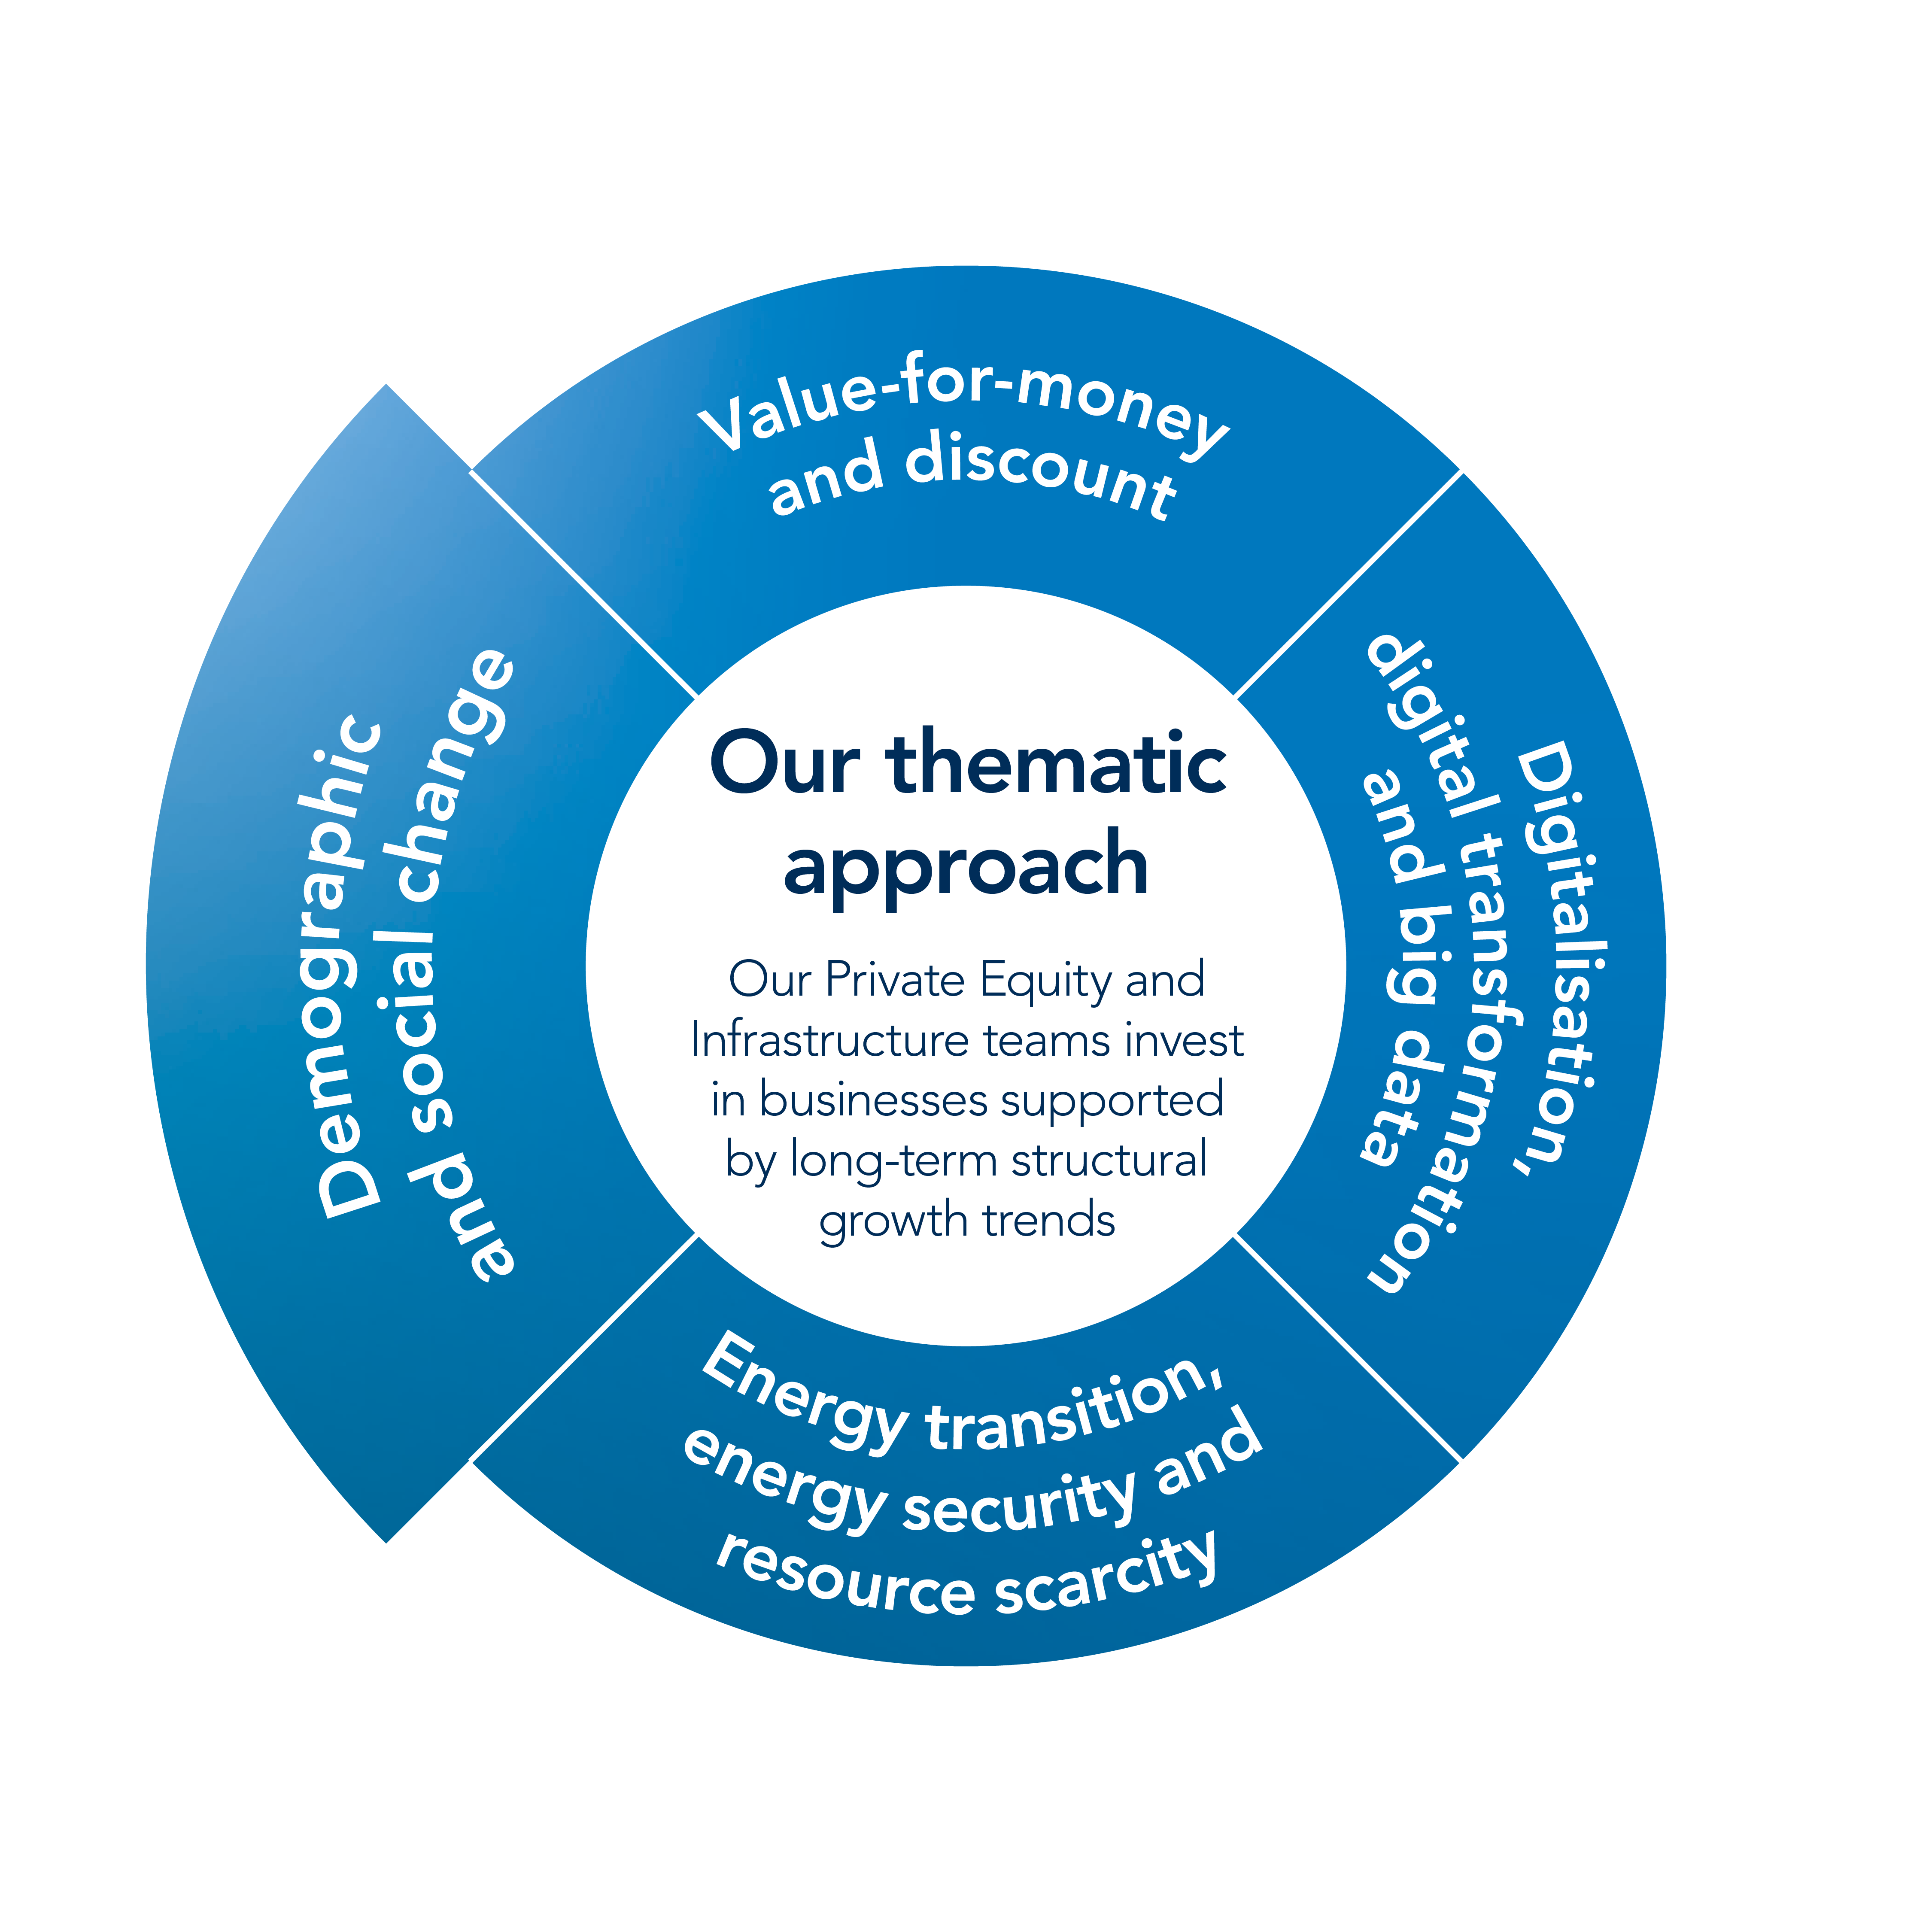
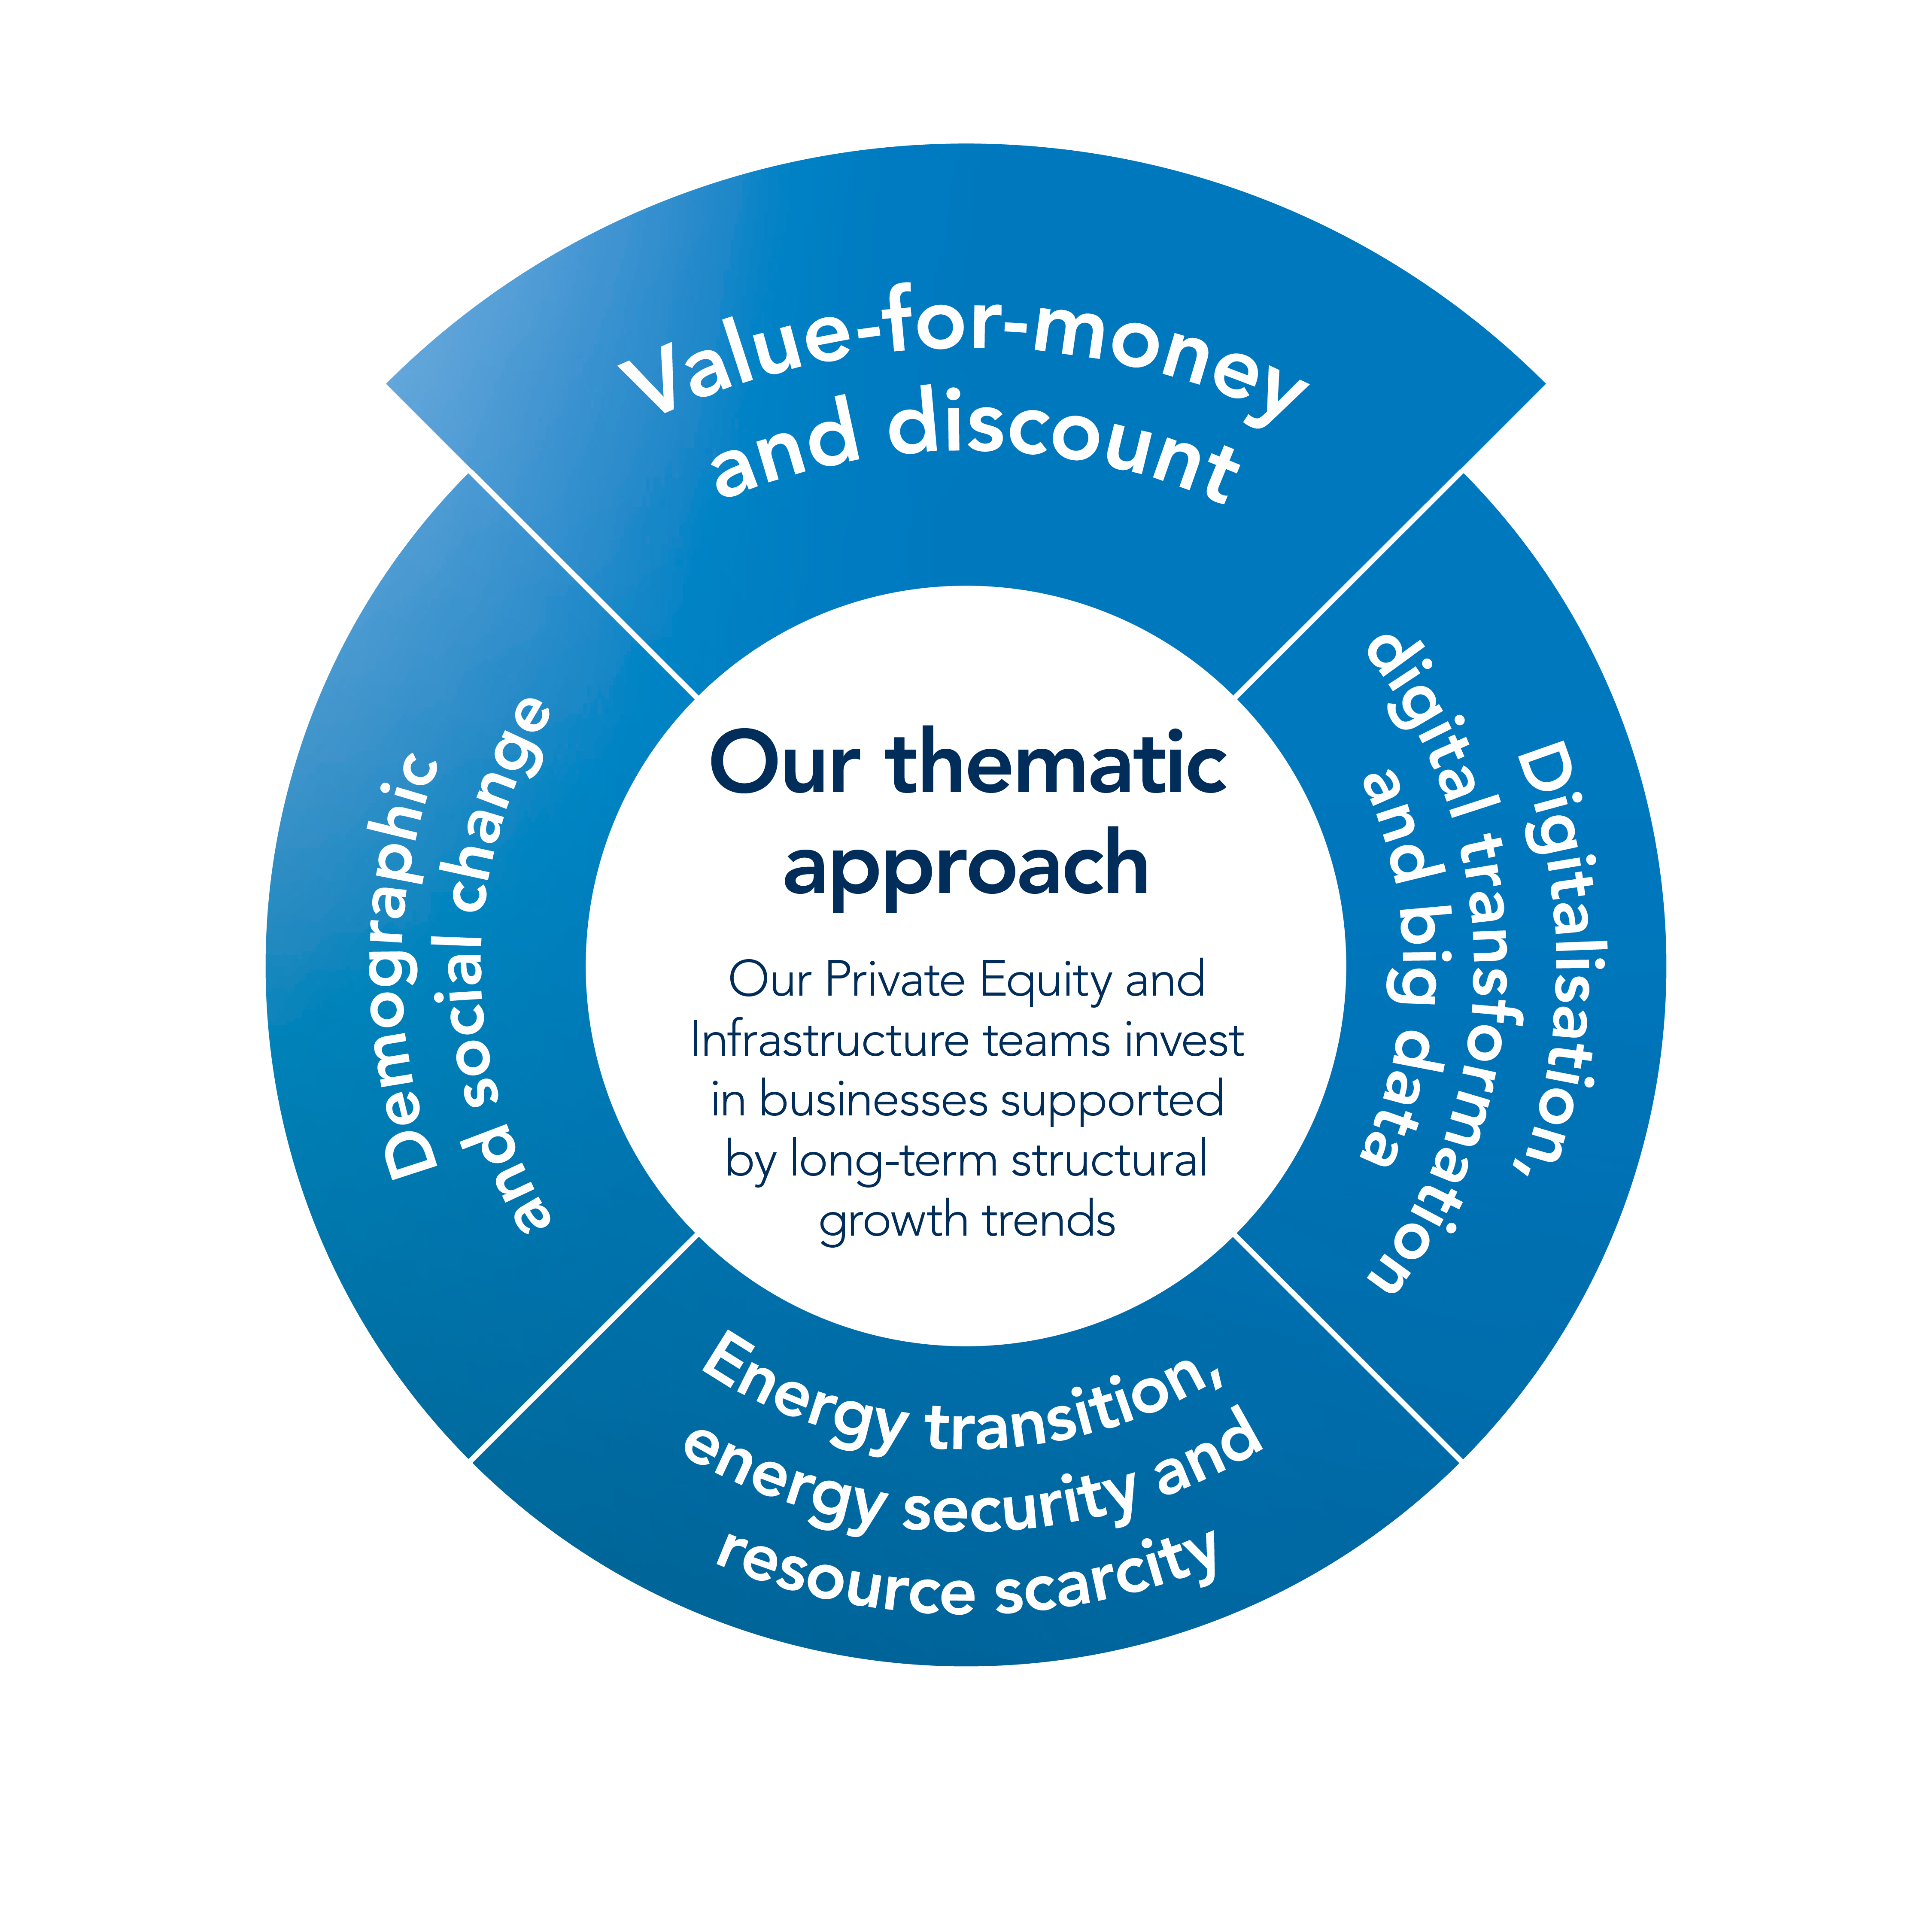
Thematic approach
Our Private Equity and Infrastructure teams invest in businesses supported by long-term structural growth trends.
Our investment approach
Our strong values and institutional culture
Our people
Global network
Our brand and reputation
Who benefits
Our model is capable of delivering mid-teen returns to shareholders through the investment cycle
-
25%
Total return on opening shareholders’ funds in FY2025
-
73.0p
Dividend per share for FY2025
-
0.4%
Operating costs as a percentage of our FY2025 AUM
Our model is capable of delivering mid-teen returns to shareholders through the investment cycle
-
25%
Total return on opening shareholders’ funds in FY2025
-
73.0p
Dividend per share for FY2025
-
0.4%
Operating costs as a percentage of our FY2025 AUM
Strategic objectives
-
 Grow investment portfolio earnings
-
 Realise investments with good cash-to-cash returns
-
 Maintain an operating cash profit
-
 Use our strong balance sheet
-
 Increase shareholder
distributions
Increase shareholder
distributions
Key performance indicators
Gross investment return (“GIR”) as % of opening portfolio value
The performance of the proprietary investment portfolio expressed as a percentage of the opening portfolio value.
Link to strategic objectives:

NAV per share
The measure of the fair value per share of our investments and other assets after the net cost of operating the business and dividends paid in the year.
Link to strategic objectives:

Cash realisations
Support our returns to shareholders, as well as our ability to invest in new opportunities.
Link to strategic objectives:

Cash investment
Identifying and investing in new and further investments is a key driver of the Group’s ability to deliver attractive returns.
Link to strategic objectives:

Operating cash profit
By covering the cash operating cost of running our business with cash income, we reduce the potential dilution of capital returns.
Link to strategic objectives:

Total shareholder return
The return to our shareholders through the movement of the share price and dividends paid during the year.
Link to strategic objectives:

A responsible approach
We believe that a responsible approach to investment aligns with our values and supports the delivery of attractive returns from our portfolio over the long term.
We have majority or significant minority holdings in our core portfolio companies and are represented on their boards.
We exercise our influence to ensure that they consider their material environmental and social impacts and dependencies and, where relevant, support them in developing plans to mitigate sustainability risks and invest in value creation opportunities that may arise.
Downloads
-
Annual report and accounts FY2025
(pdf 12.7mb) -
Business review
(pdf 1.42mb) -
Performance and risk
(pdf 736kb) -
Sustainability
(pdf 1.12mb) -
Governance
(pdf 1.55mb) -
Audited financial statements
(pdf 1.17mb) -
Portfolio and other information
(pdf 316kb) -
Annual Report and Accounts 2025
(ESEF/iXBRL with built-in iXBRL viewer) (7.9mb) -
Annual Report and Accounts 2025
(ESEF/iXBRL) (7.9mb)