Key performance indicators
We use a number of key performance indicators (KPIs) 1,2,4 to assess progress against our strategic objectives, including both financial and non-financial measures.
These KPIs are helpful in assessing progress but are not exhaustive as management also takes account of a wide range of other measures in assessing performance.
Strategic objectives
 |
Realise investments with good cash-to-cash returns |
 |
Use our strong balance sheet |
 |
Increase shareholder distributions |
 |
Grow investment portfolio earnings |
 |
Maintain an operating cash profit |
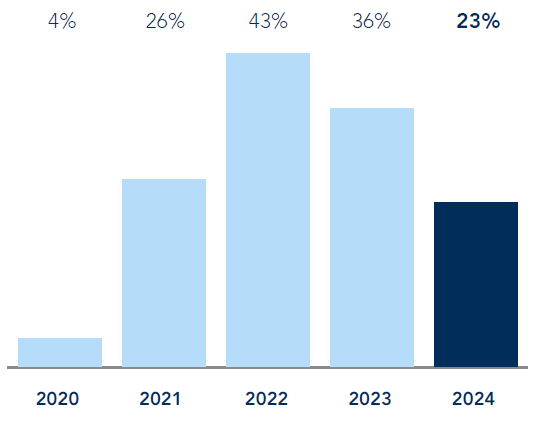
Gross investment return (“GIR”) as % of opening portfolio value
The performance of the proprietary investment portfolio expressed as a percentage of the opening portfolio value.
Strategic objectives
Progress and outlook
FY2024 progress and FY2025 outlook
- Group GIR of 23%, driven by £3,926 million of unrealised value growth and £591 million of portfolio income
- Private Equity GIR of £4,059 million, or 25%, predominantly driven by Action’s GIR of £3,718 million
- Infrastructure GIR of £99 million, or 7%, reflecting the performance of 3iN and US infrastructure
- Scandlines GIR of £10 million, or 2%, reflecting steady performance in the year and cash distributions
- Our portfolios have started FY2025 with good momentum
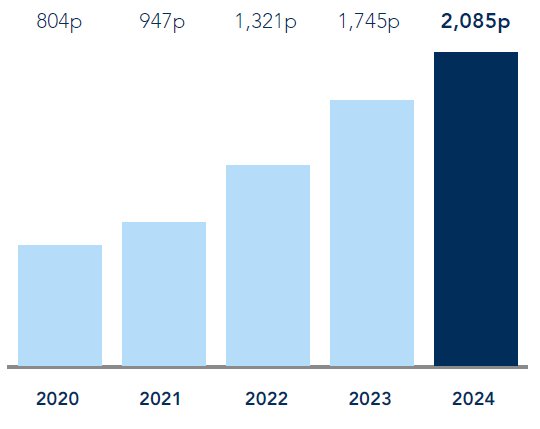
NAV per share
The measure of the fair value per share of our investments and other assets after the net cost of operating the business and dividends paid in the year.
Strategic objectives
Progress and outlook
FY2024 progress and FY2025 outlook
- 19% increase in NAV per share to 2,085 pence (31 March 2023: 1,745 pence), after payment of 56.25 pence dividend per share in the year
- Our portfolios have started FY2025 with good momentum
Cash realisations 5
Support our returns to shareholders, as well as our ability to invest in new opportunities.
Strategic objectives
Progress and outlook
FY2024 progress and FY2025 outlook
- Cash proceeds of £883 million including £762 million5 of proceeds received from Action’s capital restructuring
- Realisations and refinancings in FY2025 are subject to supportive market conditions and to portfolio company performance remaining resilient. In April 2024, we agreed the sale of nexeye, generating expected exit proceeds of c.€452 million
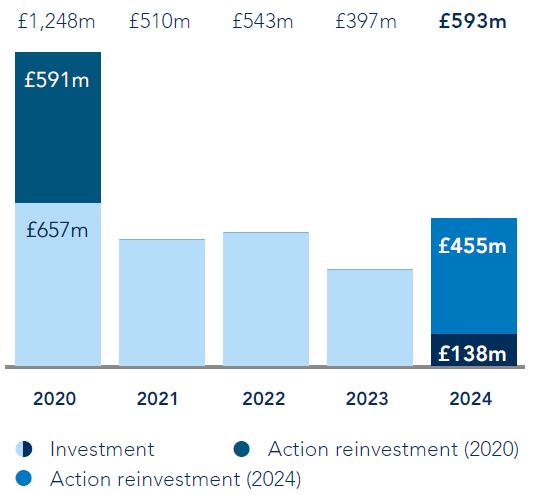
Cash investment 6
Identifying and investing in new and further investments is a key driver of the Group’s ability to deliver attractive returns.
Strategic objectives
Progress and outlook
FY2024 progress and FY2025 outlook
- Invested £593 million, including the £455 million reinvestment into Action
- Completed seven bolt-on acquisitions for the Private Equity portfolio, one of which, for EBG, we supported with further investment of £38 million. Completed one new investment in our North America Infrastructure Fund
- Interesting pipeline of new investment opportunities and bolt-on acquisitions. In early May 2024, we agreed to invest c.€116 million in a new investment for our Private Equity portfolio, Constellation
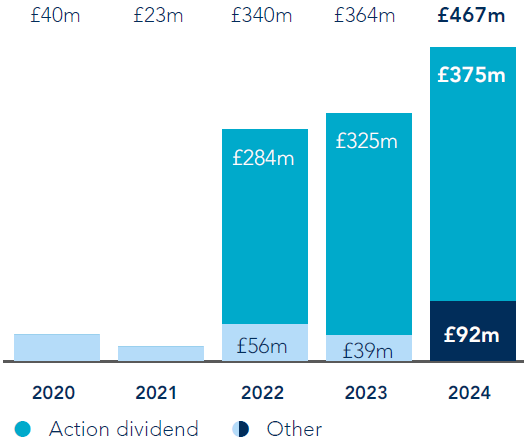
Operating cash profit 3
By covering the cash operating cost of running our business with cash income, we reduce the potential dilution of capital returns.
Strategic objectives
Progress and outlook
FY2024 progress and FY2025 outlook
- Generated total cash income of £594 million (2023: £497 million) of which £456 million (2023: £351 million) is from Private Equity, £113 million (2023: £107 million) from Infrastructure and £25 million from Scandlines (2023: £39 million). Private Equity includes £375 million of dividends from Action (2023: £325 million)
- Cash operating expenses of £127 million (2023: £133 million)
- Good cash income expected to continue from Action, Infrastructure and Scandlines
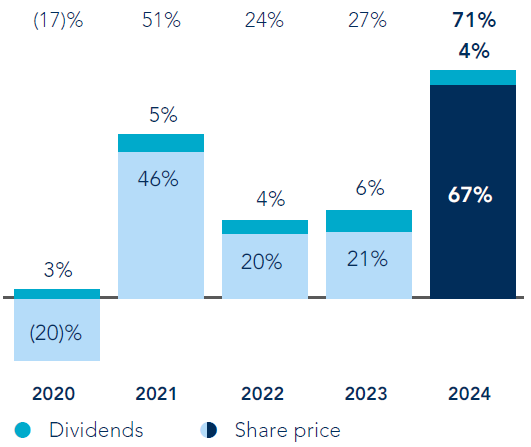
Total shareholder return
The return to our shareholders through the movement of the share price and dividends paid during the year.
Strategic objectives
Progress and outlook
FY2024 progress and FY2025 outlook
- TSR of 71% driven by a share price increase of 67% and by dividend payments of 56.25 pence in the year
- Well-positioned balance sheet supports a total FY2024 dividend of 61.0 pence per share
1 A number of our KPIs are calculated using financial information which is not defined under IFRS and therefore they are classified as APMs. Further details on these APMs are included in the Financial review on page 79 of our Annual report and accounts 2024.
2 Further information on how these KPIs are factored into decisions concerning the Executive Directors’ remuneration is included in the Directors’ remuneration report on page 136 of our Annual report and accounts 2024.
3 Cash operating expenses includes lease payments.
4 Key risks which could potentially impact the respective KPIs can be found on pages 89 to 93 of our Annual report and accounts 2024, which summarises the Group's current principal risks.
5 Realised proceeds may differ from cash proceeds due to timing of cash receipts. During the year, Private Equity recognised £866 million of realised proceeds, of which £5 million relates to WHT incurred on the proceeds from Action.
6 Cash investment per the segmental analysis is different to cash investment per the cash flow due to a £10 million investment in Private Equity, which was recognised in FY2023 and paid in FY2024.